Mapstraction API
Posted: January 26, 2012 Filed under: Application Programming Interfaces, Learning Resources | Tags: apis, books, javascript, mapstraction Comments Off on Mapstraction APIThe Mapstraction JavaScript API allows you to easily switch between the leading web map providers for your application. This allows you to code for just one API but tap into the resources and base maps provided by other APIs.
From the Mapstraction site:
Users can switch maps as desired based on personal taste and quality of maps in their local area. Various tools built on top of Mapstraction allow users to easily integrate maps into their own sites, and configure them with different controls, styles, and provider.
One tool they have provided is an API Sandbox, allowing you to view examples of Mapstraction in action, but with the code exposed to you in an editable text box. You can modify the JavaScript and see how your changes will appear in the map below. This is a great benefit to those looking to tinker with the API.
Another resource for learning how to make web maps is Map Scripting 101 by Adam DuVander. The book focuses on Mapstraction, using the API as the primary means of demonstrating JavaScript-based web mapping technology. I have not yet had the chance to read the book, but once I do, I will review it here. In addition to the Map Scripting 101 book, DuVander also provides a simple, concise “Start Here Guide” for those completely new to web mapping. The Guide is freely available through the link above.
I plan to discuss Mapstraction more over the next few posts. With Google’s recent change to their API Terms, many are switching from the Google Maps API and Mapstraction will undoubtably play a role in some users’ transition schemes.
Share this article with your friends.
Dymaxion Web Mapping
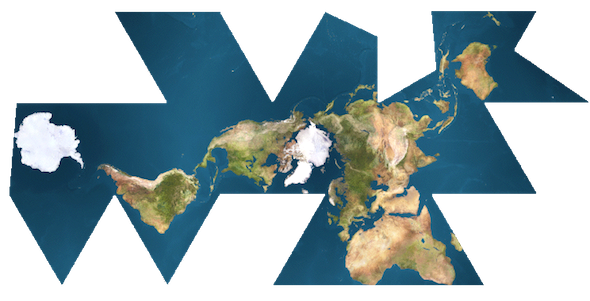
Posted: January 25, 2012 Filed under: Application Programming Interfaces, Web Map Examples | Tags: dymaxion, flash, javascript, openlayers, projections Comments Off on Dymaxion Web MappingR. Buckminster Fuller was truly a modern Renaissance Man. Bucky created many inventions and championed several ideas that have shaped the way we live. One of his creations is the Dymaxion map projection. The map projection is rather complex; the developable surface is an icosahedron. When the icosahedron is then sliced and flattened, it produces a world map that is visually intriguing. It is truly unlike any other map projection.
Though difficult to produce, the code for producing such a projection in a web map is available. Using the OpenLayers JavaScript API and some custom JavaScript from Protovis, Zachary Johnson was able to put together this demo of the Fuller/Dymaxion Projection as the projection for a web map.
In Zachary’s post, he also mentions the Faumaxion web map, which is a Flash-based web map that reorients itself so that north is at the top for any of the triangular faces of the Dymaxion projection. Michal Migurski, a partner at Stamen Design, has the details on how he created the Dymaxion slippy map.
The downside to using a Dymaxion projection in your web map is that the support for the projection amongst the mapping APIs is minimal. You will need to do more of the heavy lifting in order to get this projection working properly in your web map. That’s also ignoring the fact that many people are not spatially aware and that this different projection will require your audience to orient themselves with the way the Earth has been projected. While Spherical Mercator is common and familiar, it does grossly exaggerate the areas closer to the poles, which in turn distorts your mapped data. Choropleth maps depicting a variable dependent on area, such as population density, are often misleading when mapped with a Mercator projection. The Dymaxion map is closer to an equal-area map than most, however the variable orientation towards North makes this projection a hard sell to a general audience.
Nonetheless, the Dymaxion map is an incredible map projection, from both a scientific and aesthetic point of view. The time spent by some very dedicated, intelligent people to get this working in interactive form speaks to the admiration of the projection and its creator. If only Bucky had lived long enough to see what wonders the Internet hath brought…
Share!
New to Web Mapping? Get started with Google’s Mapping APIs
Posted: January 24, 2012 Filed under: Application Programming Interfaces | Tags: apis, flash, google, javascript, kml, maps Comments Off on New to Web Mapping? Get started with Google’s Mapping APIsIf you have no experience with web mapping, but have some basic website-building experience, you can begin to make interactive web maps fairly easily using Google’s mapping application programming interfaces (APIs).
Google’s map API page shows you the available APIs for you to use. If you are looking to make maps like those you often see depicting store locations or basic points-on-a-map pages, check out the JavaScript API. There are many tutorials out there to help you get started with mapping, however all of them assume you are familiar with hosting your own web pages. If you’re not sure how to host your own pages, you can still get started with web mapping by using the My Maps functionality of Google Maps.
There are also several other JavaScript-based APIs for mapping, such as OpenLayers, Mapstraction, and ESRI’s JS API. All of these will allow you to embed maps with custom content into your own web pages, however each one has a different learning curve and provide different base maps out of the box.
Recommend this article.
Driving Through Time: The Digital Blue Ridge Parkway
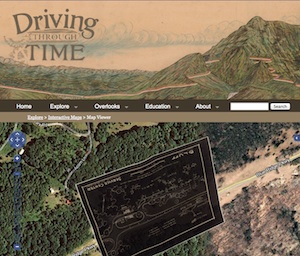
Posted: January 23, 2012 Filed under: Web Map Examples | Tags: blue ridge parkway, examples, historic maps, north carolina, photographs Comments Off on Driving Through Time: The Digital Blue Ridge Parkway The University of North Carolina has developed an awesome way to explore historic photographs and maps of the Blue Ridge Parkway. Driving Through Time features two web maps that serve as the primary means of exploring their digital catalog of photographs and scanned paper maps.
The GeoBrowse map uses OpenLayers as the client-side mapping API and Google’s base map tiles to serve as the backdrop. The individual markers are clustered at lower zoom levels, as a large number of markers would clutter the display. Clicking on a cluster marker will bring up a slideshow of images found within the clicked cluster below the map, which is a nice touch. Usually, many map developers use the cluster to support a pop-up map window/balloon; to me, the balloon is not as easy to navigate as what they have done here. Another nice touch of the GeoBrowse map is the ability to filter the map markers by category or date range. The filtering is being performed server-side, which requires a reload of the page. Personally, I would perform the filtering client-side in JavaScript or use an AJAX call, that way you do not need to reload the page each time a new category is selected.
The link titled “Interactive Maps” brings you to a listing of historic maps that have been scanned in and georectified to align with the base map and imagery provided by Google. The map uses a slider control to adjust the opacity of the overlay image, which allows the user to easily view the differences between the aerial photography and the historic map. This map of the Bluff Service Center has some cool hand-lettering, but because the map was not oriented to north, it’s upside down! Very few JavaScript APIs support non-North orientation at this time, so unless you use a more robust platform, such as Flash/Flex or the Google Earth API, you’re stuck with North oriented maps.The upside here is that they provide a KML file for each map, which will allow you to bring the scanned map into Google Earth. By the way, the scanned maps are then projected into the Spherical Mercator projection, and then cached. These cached map tiles are then made available through a Tiled Map Service (TMS) server.
Driving Through Time is a great example of making information accessible using web maps. These documents have likely been with the UNC Library system or the State of North Carolina for years, unseen by the public because they existed only as hard copies. Now that they are available through a web map, you can explore the history of the Blue Ridge Parkway from anywhere in the world.
Recommend this article.
Welcome to LearnWebMapping.com
Posted: January 22, 2012 Filed under: Course Updates Comments Off on Welcome to LearnWebMapping.comWelcome! I am developing LearnWebMapping.com as a resource for you to find information about web mapping concepts, APIs, tips and tricks. I am also developing an online college course on web mapping, including a discussion of client-side mapping interfaces, GIS services, and best practices to help you build awesome map applications. You can find out more about the course offered through Rowan University Online at the About the Course link here and above.
Check back as I post articles and links to interesting web maps for inspiration and educational resources for guidance on your next project.


Recent Comments